

GNAR's own official August closings report wasn't verifiable at publish time, so this update leans on the most recent confirmed Redfin and Realtracs data instead — flagged clearly below.
KEY TAKEAWAY
Nashville's median sold price sat near $549,000 in August 2026, while the broader nine-county metro carried 14,546 active listings as of July, up 19.3% year-over-year — the fastest inventory growth of any major U.S. metro. Homes averaged 54 days on market and 7.2 months of supply, keeping Nashville among the strongest buyer's markets in the country. GNAR's own official August closings report wasn't verifiable as of this post's publish date; once it's out, we'll update this page with the direct month-over-month comparison this post originally led with.
What We Actually Know Right Now
A note on sourcing before the numbers: Greater Nashville REALTORS® (GNAR) typically publishes its official monthly closings report around the fifth of the following month — the same report that gave us July's hard number of 3,269 closings, down 2% year-over-year. As of this post's publish date, GNAR's official August release wasn't yet verifiable through our normal channels, so this update leans on the most recent confirmed data from Redfin and Realtracs instead. We'll fold in GNAR's own August closings count and update this page directly once it's out.
Here's what the available data does show: Nashville's median sold price sat near $549,000 in August, and the broader market continues to carry historically high inventory into the fall.

LOCAL INSIGHT
Nashville's nine-county metro carried 14,546 active listings as of July 2026, per Redfin, up 19.3% year-over-year — the fastest inventory growth of any major U.S. metro. That's the backdrop for every pricing conversation we're having with sellers this fall.
Inventory Is Still Climbing
The most recent verified metro-wide figure comes from Redfin's July 2026 data: 14,546 active listings across the Nashville area, up 19.3% year-over-year, the fastest inventory growth rate of any major U.S. metro tracked. Months of supply sits at 7.2, more than double what's typically considered a balanced market. That's the same trend that drove July's closings dip in the first place, and nothing in the price or days-on-market data suggests it reversed heading into August.
The market isn't collapsing — it's handing buyers more room to breathe than they've had in years, and sellers need to price like it.
Mortgage Rates Haven't Moved Much
Rates remain in the same band that's shaped the market all summer. Nashville-area 30-year fixed mortgages are running roughly 6.25% to 6.75%, with the Federal Reserve signaling a cautious, gradual approach to further cuts rather than any sharp move in either direction. That keeps serious, qualified buyers active without bringing back the urgency of 2021's bidding wars.
Quick Stats
Median Sold Price
~$549,000 (August 2026)
Active Listings
14,546 (July 2026), up 19.3% YoY
Avg. Days on Market
54 days
Months of Supply
7.2 months
Days on Market and What It Means for Pricing Power
Homes across the metro are averaging 54 days on market before going under contract, per Redfin's most recent data, up from the 28-to-33-day range we cited in our July update. That's a meaningful shift in a single month and matches the broader story: Nashville is now one of the strongest buyer's markets in the country, with buyer leverage at its highest point in years.
For sellers, this changes the math on pricing. A home priced against last spring's comps, rather than this fall's, is the one most likely to sit well past 60 or 90 days.
BEST FOR
Buyers and sellers across the Nashville-area market tracking where prices, inventory, and days on market stand heading into fall 2026.
What This Means If You're Selling This Fall
Price to what's actually closing now, not to what a similar home sold for in the spring. With inventory still climbing and days on market stretching out, an overpriced listing doesn't just sit quietly — it actively signals to buyers that something's off compared to the dozens of other options they're weighing.
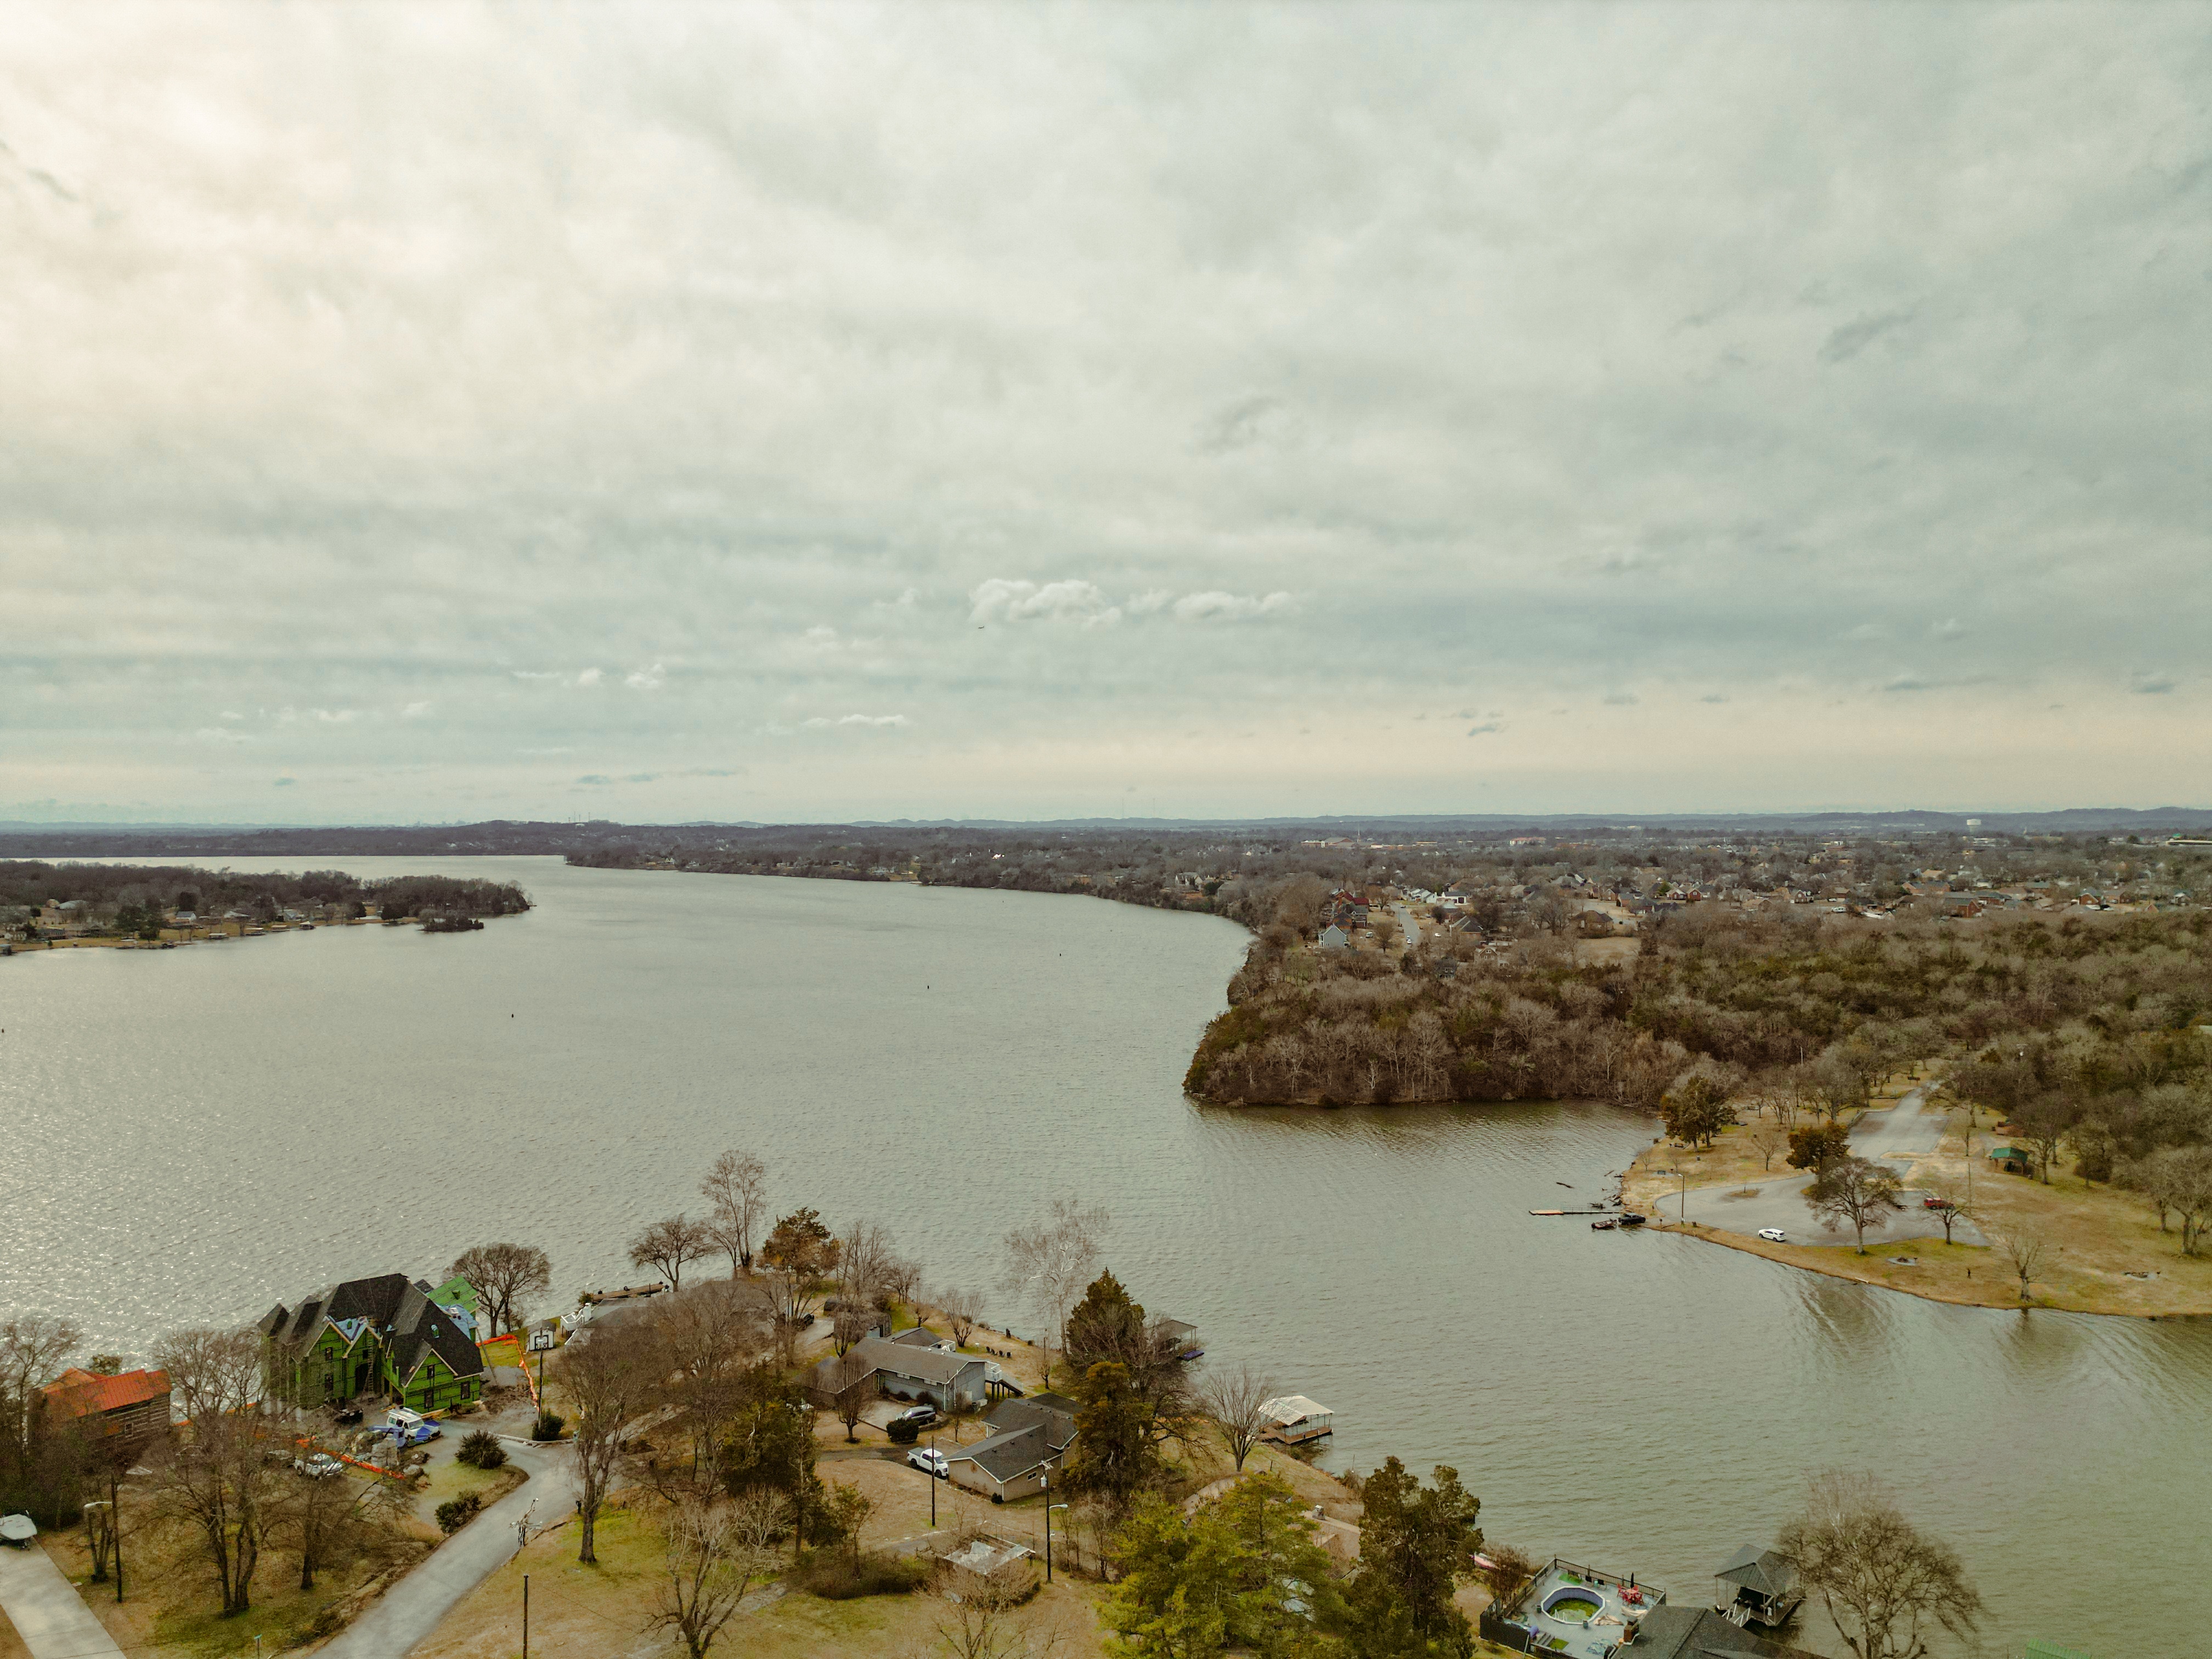
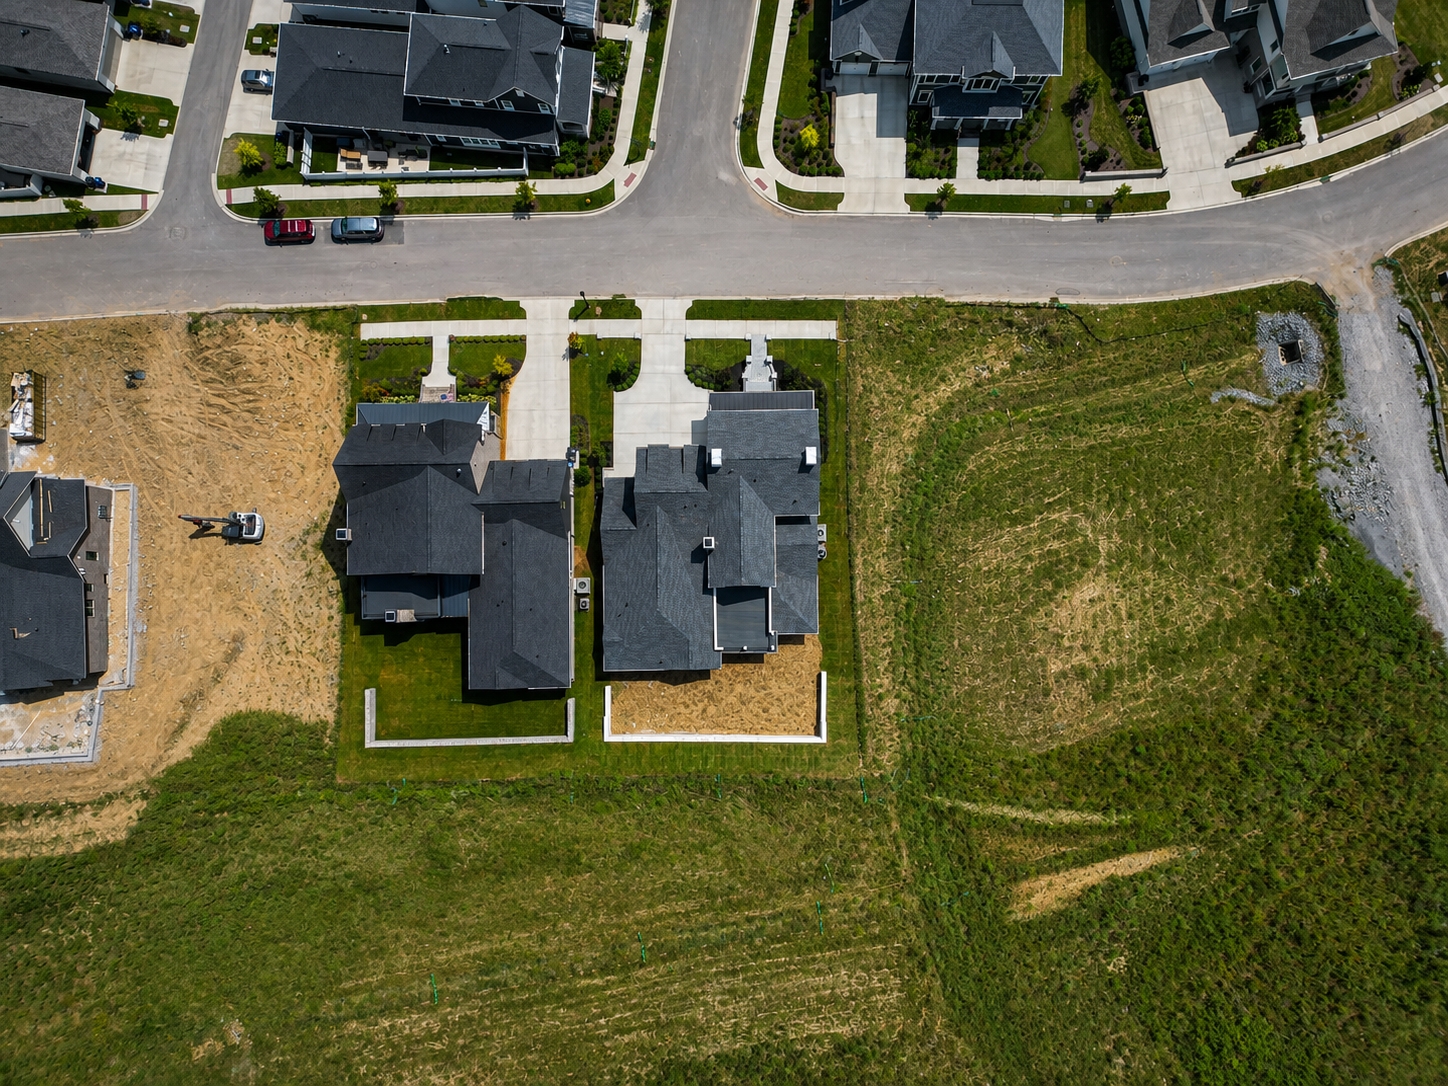
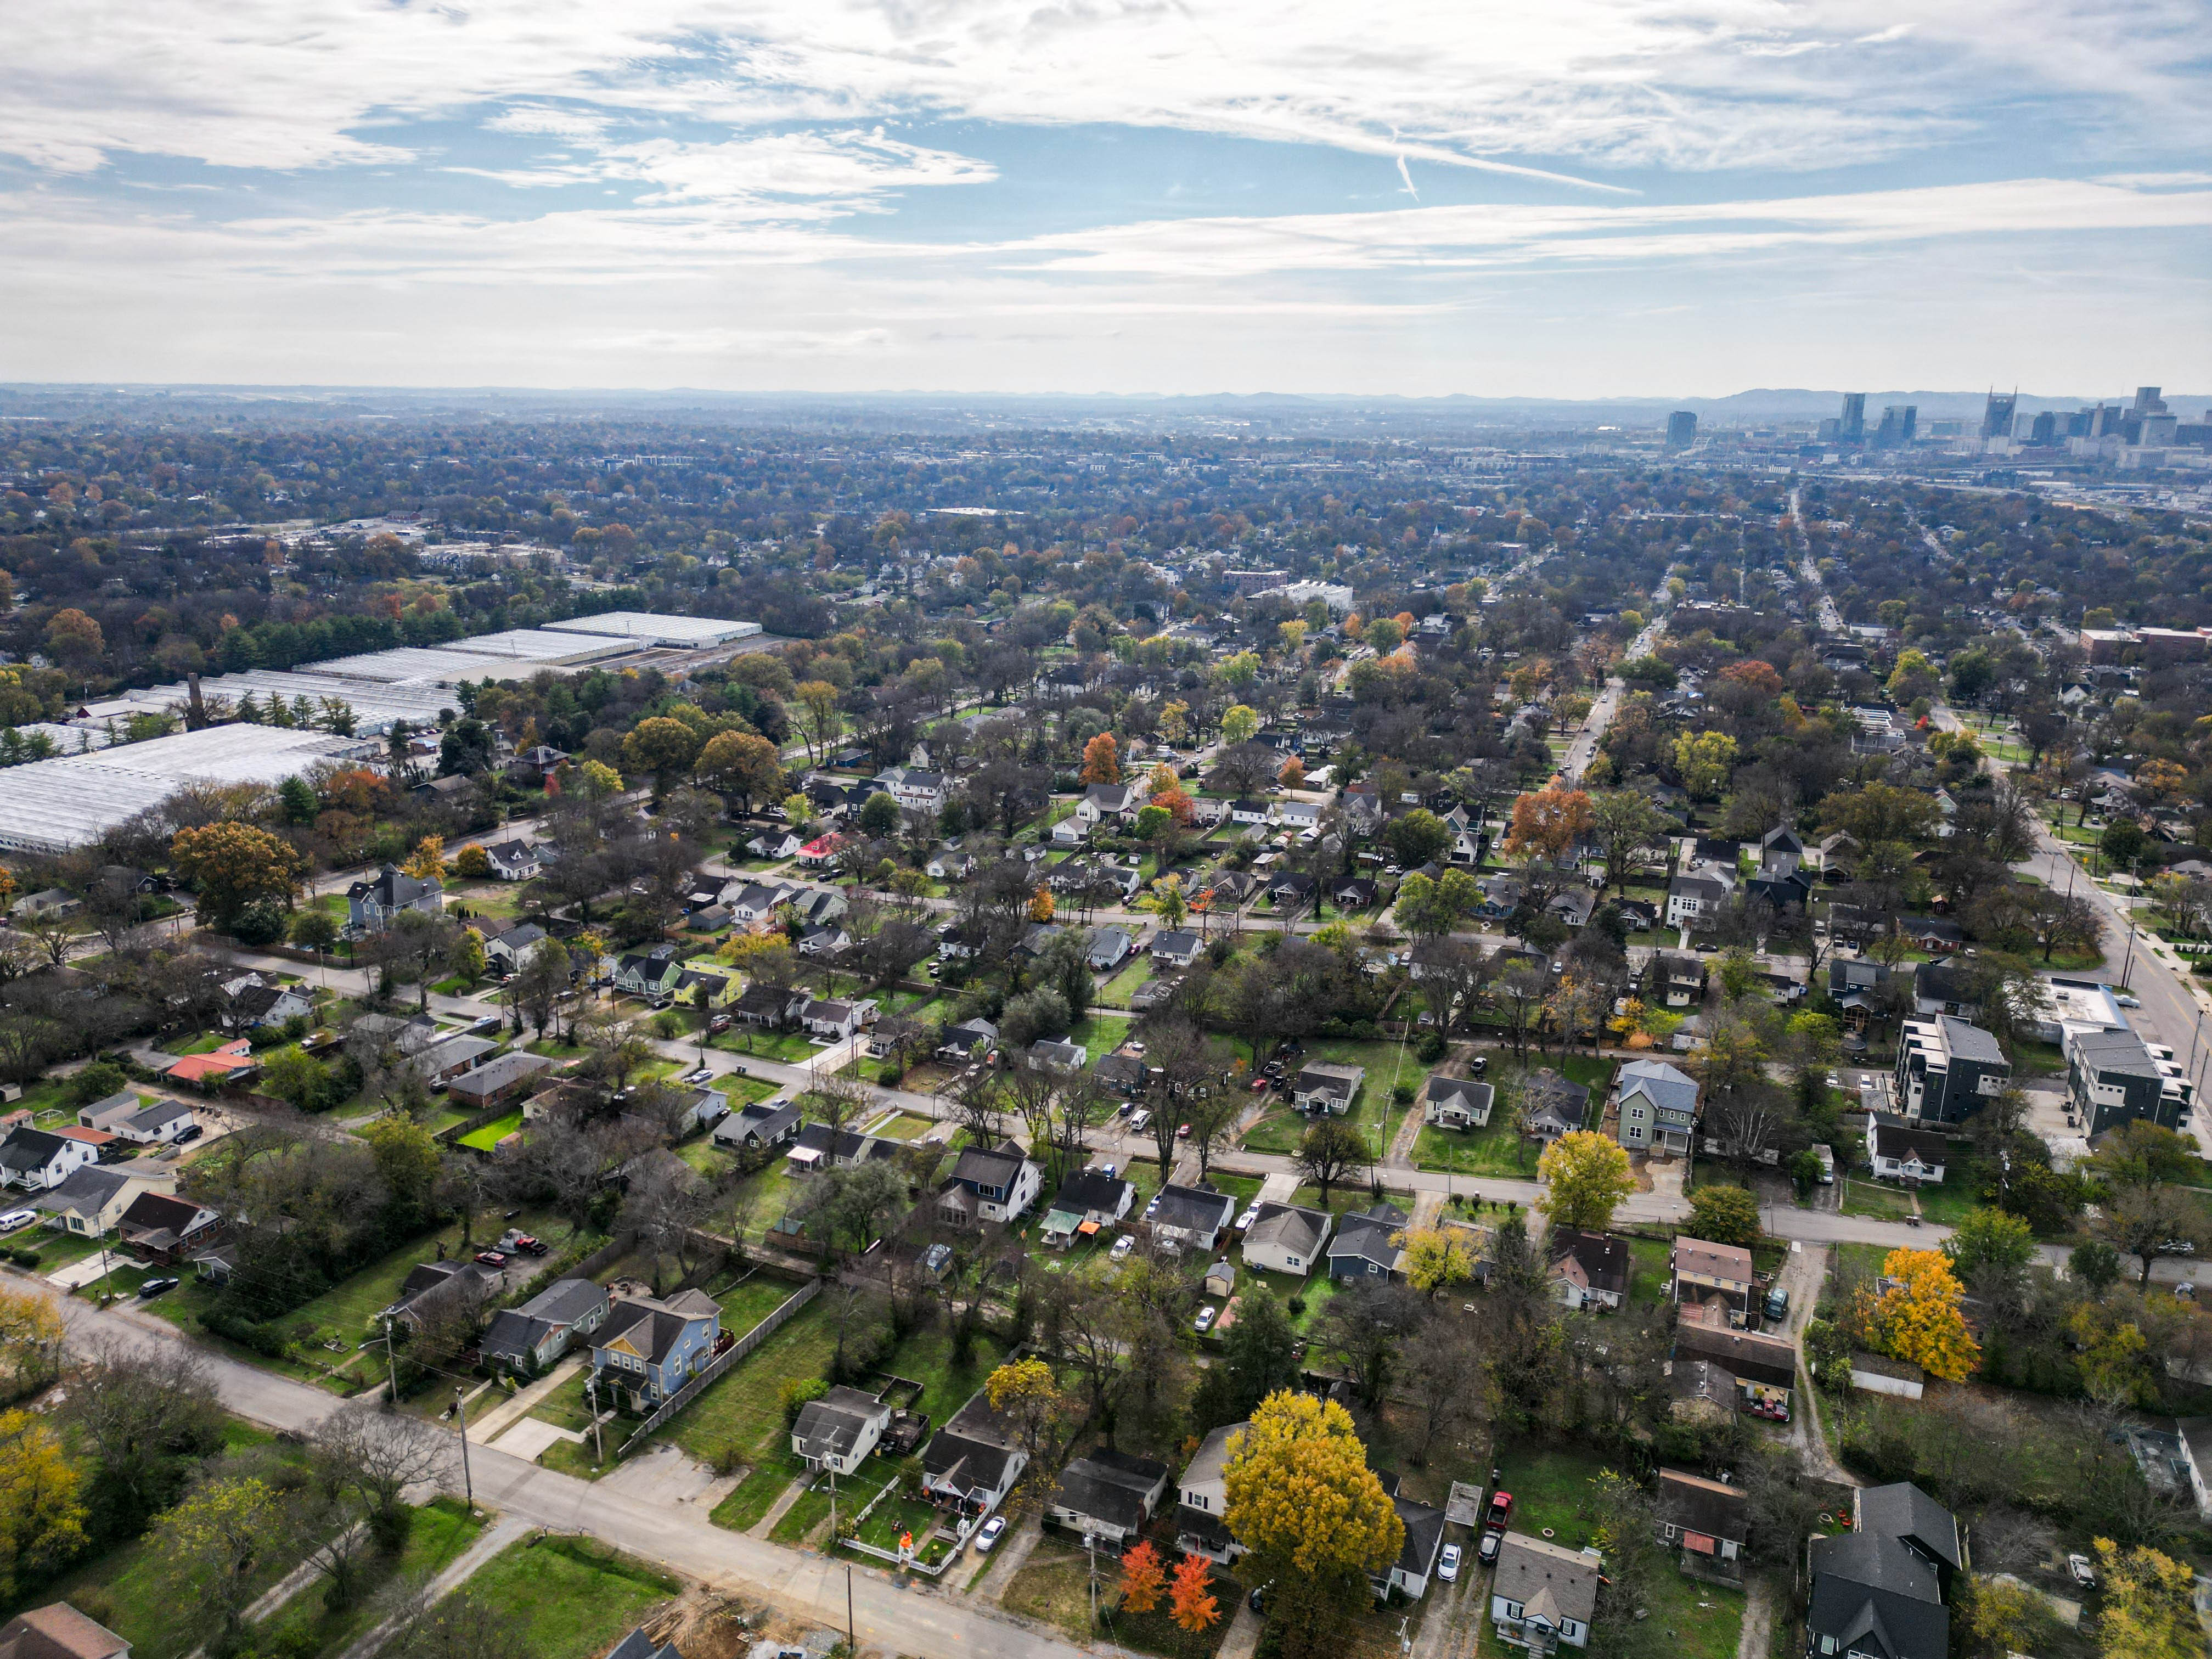
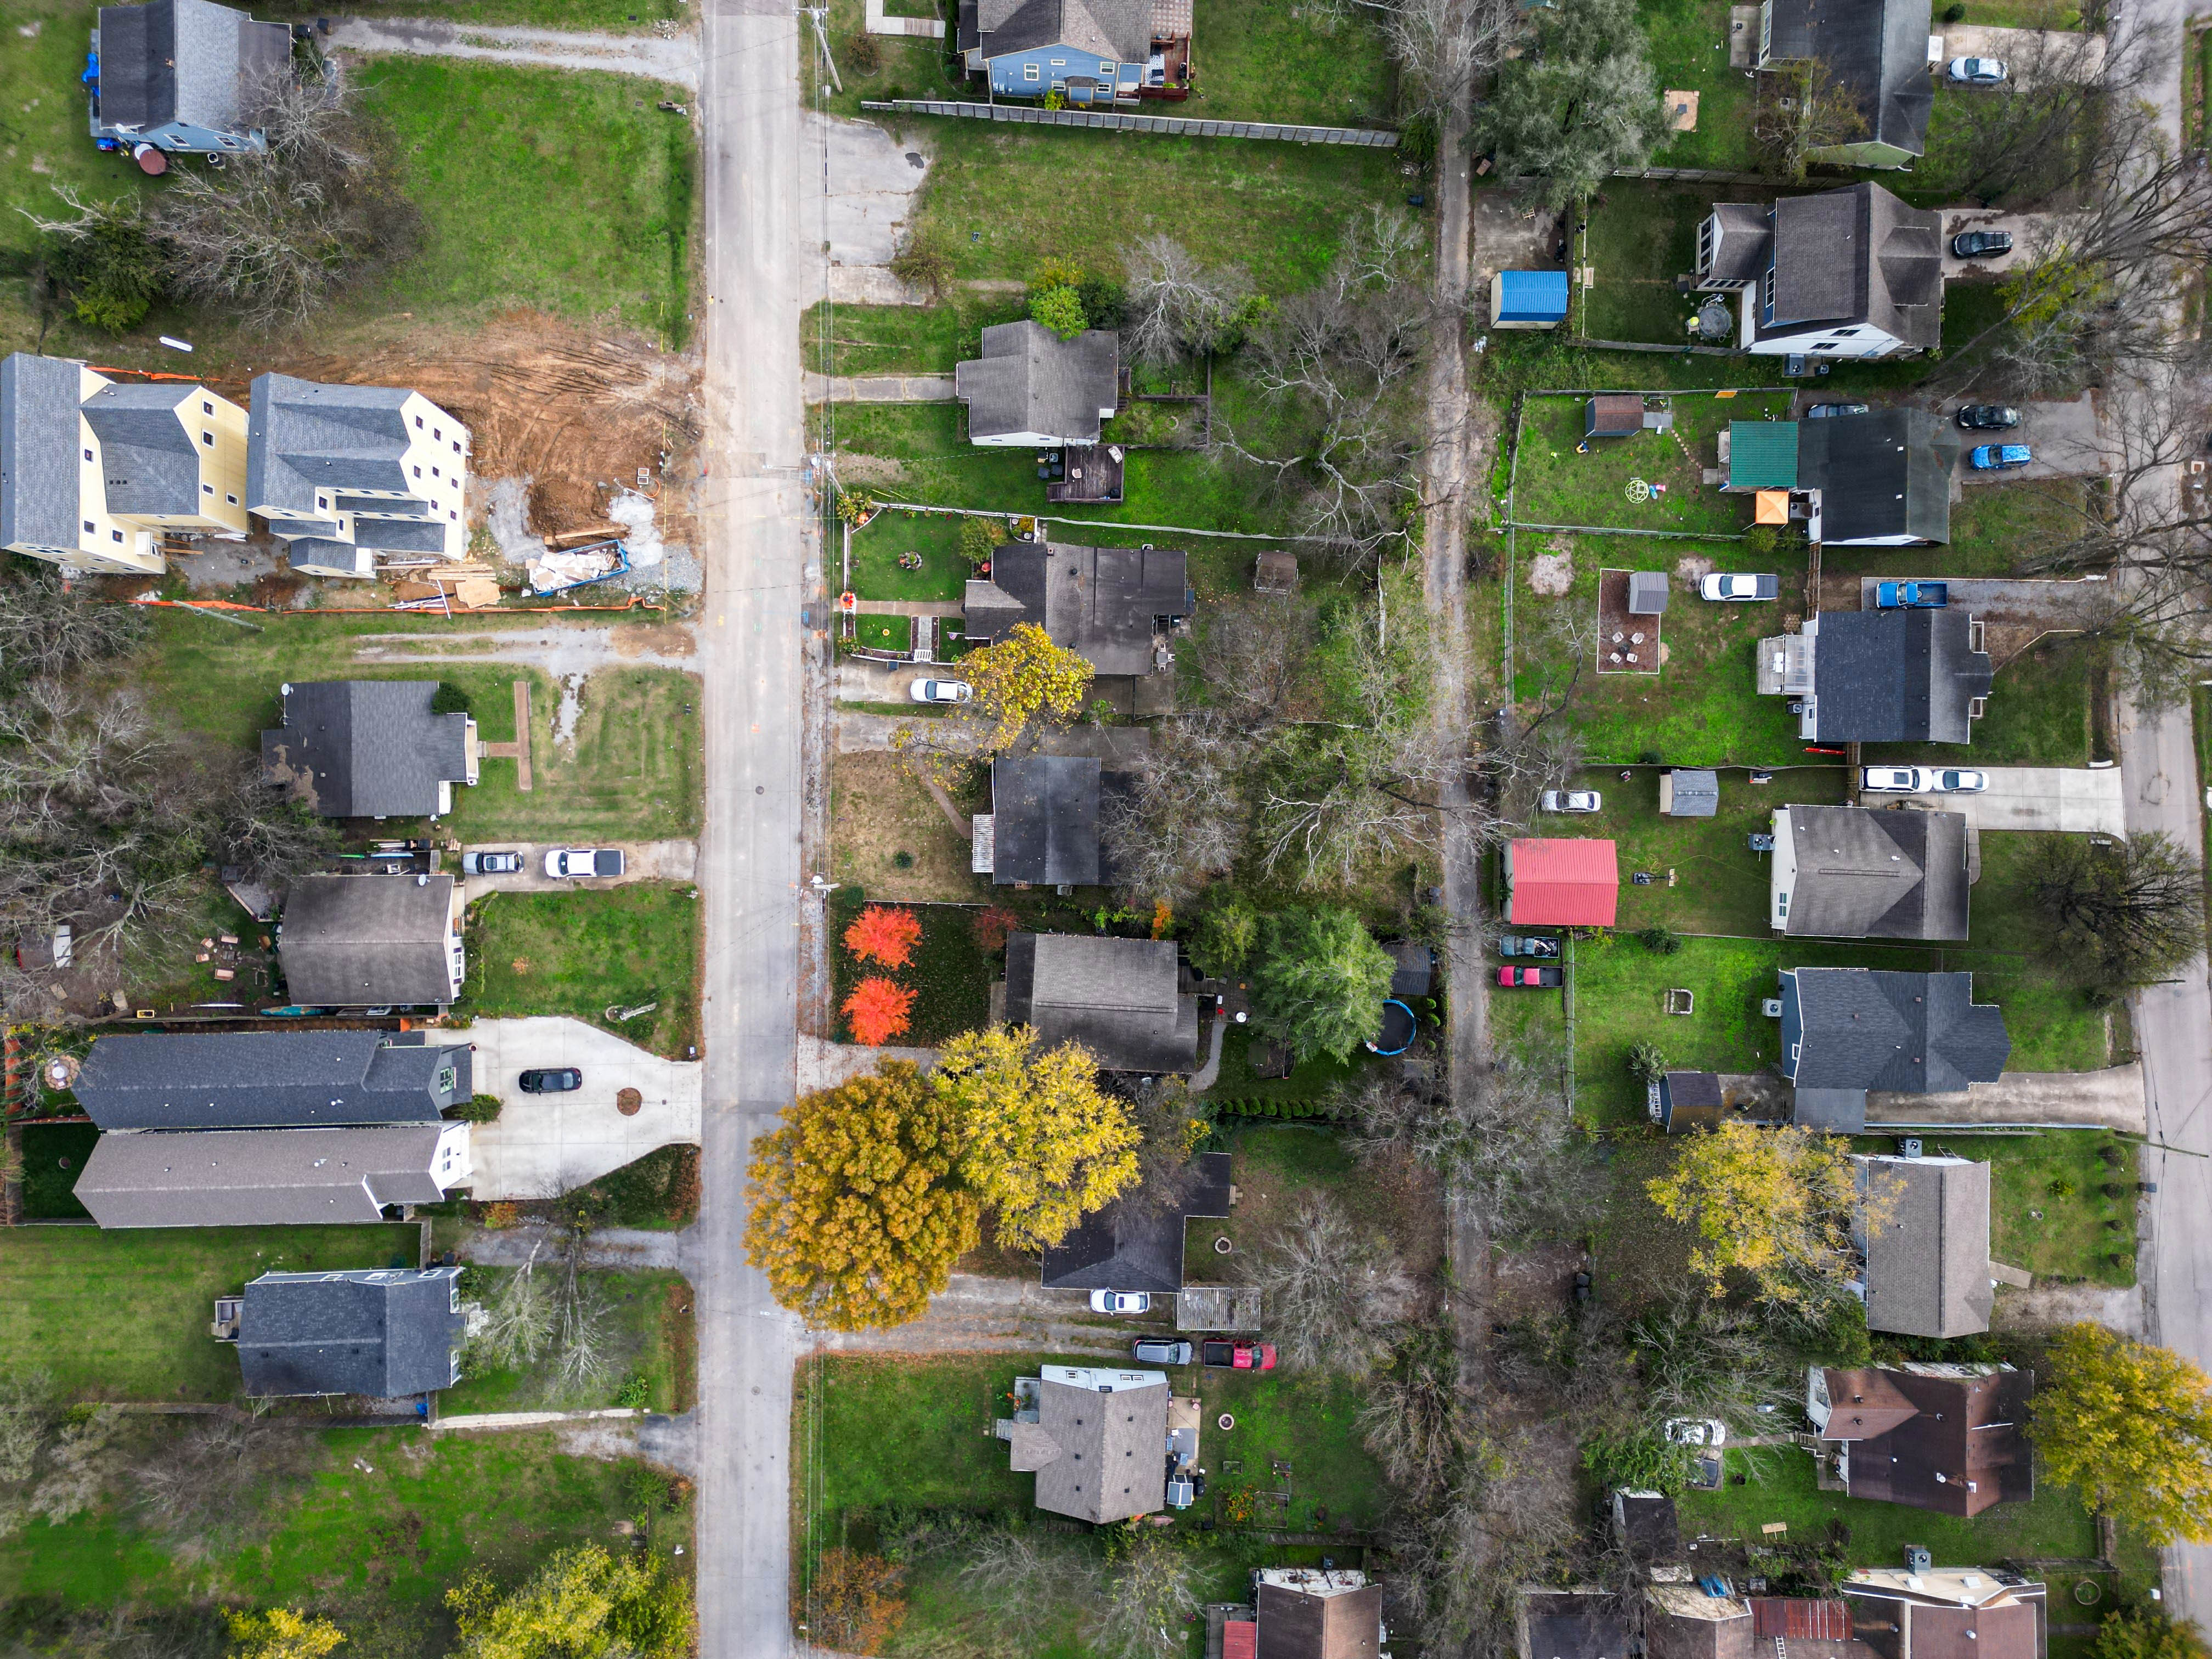
Media matters more in a crowded market, not less. When a buyer has that many comparable homes to sort through, the listing with real drone coverage, a clean walkthrough, and honest photography is the one that earns the showing.
TIP
When GNAR's official monthly report cites a different closings count than another source, check the counties and property types covered before assuming one figure is wrong — different reports track different scopes.
What This Means If You're Buying — and What We're Watching Next
Buyers have more leverage and more time than they did a year ago, but rates aren't moving enough to change the pre-approval math, so get that number locked in before you start touring seriously. The well-priced, well-presented homes in strong school zones and walkable pockets are still moving at a normal pace; it's the overpriced or poorly marketed listings stretching out that 7.2-month supply figure.
We'll update this post directly once GNAR's official August closings report is out, with the real month-over-month closings comparison this page originally led with.
A Few Quick Questions
Why doesn't this post include GNAR's official August closings number? GNAR's report wasn't verifiable through our normal sourcing as of publish. We used the most recent confirmed Redfin and Realtracs data instead and will update this page once GNAR's release is out.
Is the Nashville market crashing? No. Rising inventory and longer days on market point to a rebalancing toward buyers, not a collapse in prices — the median sold price is holding near $549,000.
Which area does this data cover? The Redfin inventory and days-on-market figures reflect the broader Nashville metro area; the median sold price reflects Realtracs-sourced Nashville MSA data.